Reporting is a classification system for the relevant information of your business and serves to make it accessible to the different internal departments of your company, according to their needs and in a fast and intuitive way.
Table of Contents
1. What is business reporting?
Business reporting is the set of comprehensive reports with information on the activities and financial performance of a company over a year.
In the past, it was intended only for companies with a lot of capital and that were listed on the stock market. Nowadays, any type of business, of whatever size, should be taking a closer look at its business reports when making important decisions.
Do you think you have all the information you need to make decisions for your company? If you think that your business is too small to need this type of strategy, you are missing improvement opportunities.
Today, it is much easier to access a good management reporting system without investing large amounts of money. When you incorporate an ERP into your company, you also aim for a reporting module that gives you the necessary information to anticipate any problems that may arise.
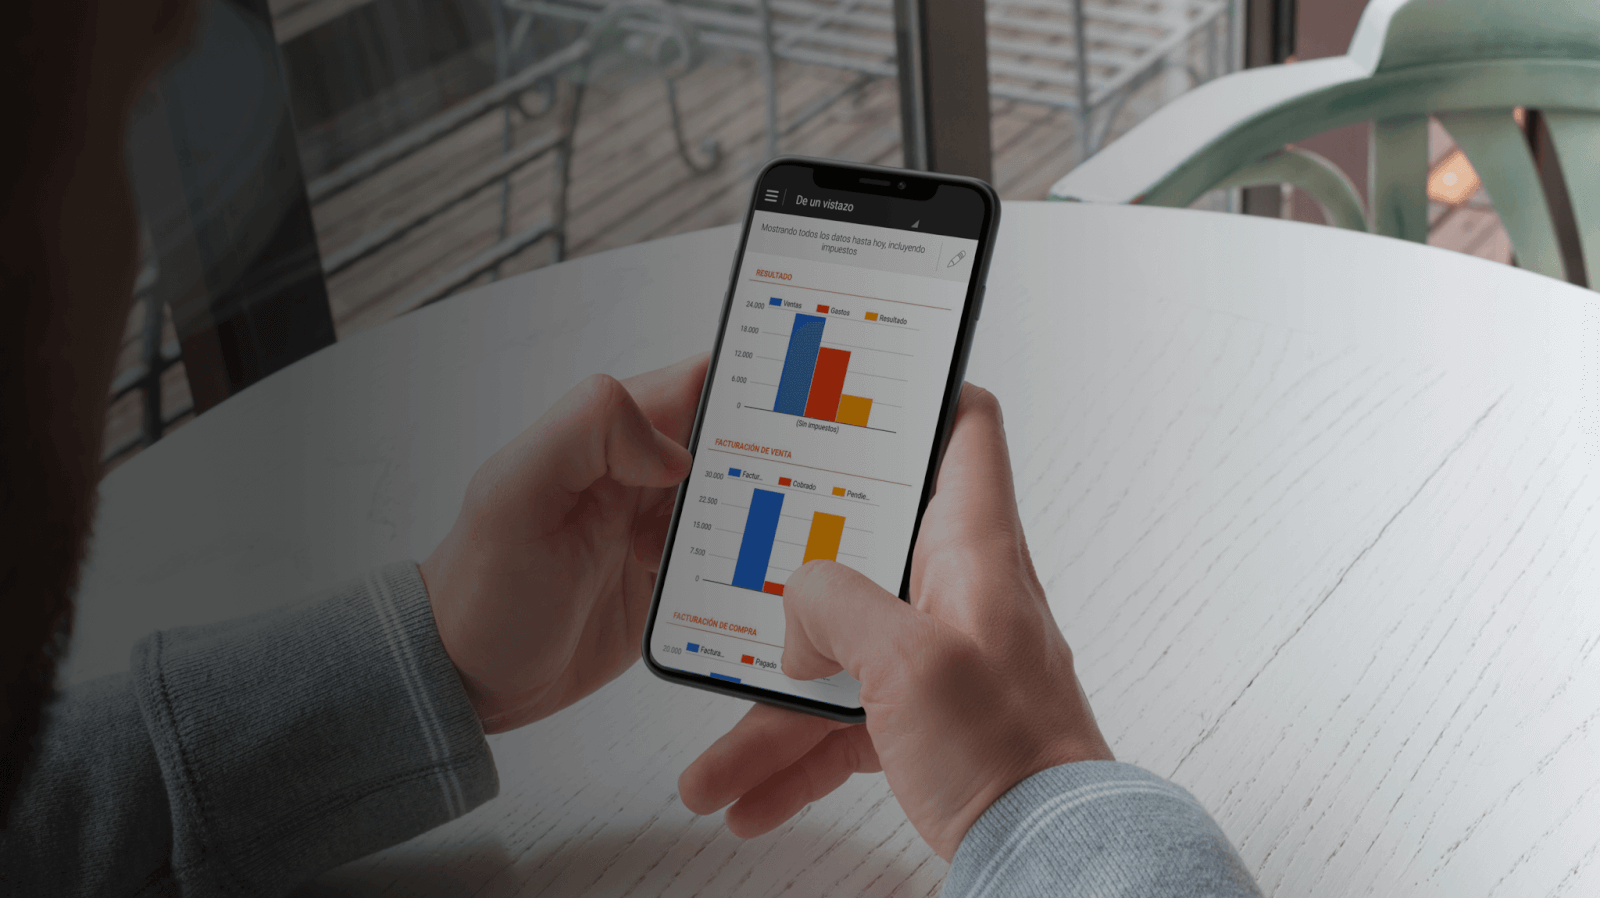
| In STEL Order you have, in real time, the necessary information on the sale of your products or clients to make the best decisions when investing more or less resources in certain commercial actions. |
2. Advantages of having a reporting system
-
Improve decision making by identifying and solving your company’s management problems before they occur.
-
Increase the competitiveness, efficacy and efficiency of your employees by knowing their sales and time invested at work.
-
Analyse the evolution of your company from a certain period to know what changes or business decisions were right.
-
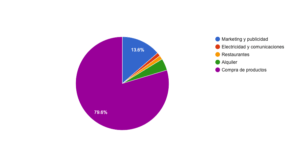
Improve your knowledge about the profitability of your products or services. With reports on the sale of products or services, you can assess which are the most profitable when offering them to your clients.
-
Get a risk assessment of non-payments of your clients avoiding annual capital losses.
-
Additional information about your clients’ requirements helps you offer a better service to the public.
-
With the purchase and stock reports, you can plan the purchases to your suppliers and spend money on those products that you sell the least or that do not achieve the profitability you are looking for.
3. Reporting characteristics
-
- Good reporting must provide you with knowledge about the business to create an organizational structure that allows you to carry out a proper assessment of the management control of your company.
- Reports must be generated in real time and be available in the cloud, so that you can access them at any time and wherever you are.
- You can access your data from any device and without being in the office.
- Reports must have access to the complete management of your company and be organized by areas (financial, treasury, sales, purchases, invoicing, catalogue, clients…) to perform a good data analysis globally, such as:
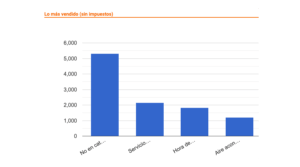
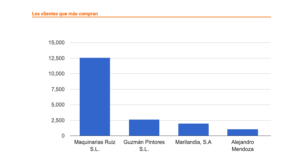
- Invoicing reports: Information about which clients buy the most, the employees who sell the most or the best-selling products.
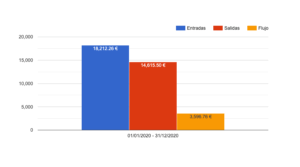
- Treasury reports: Information on capital inflows and outflows and payment methods.
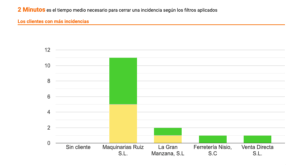
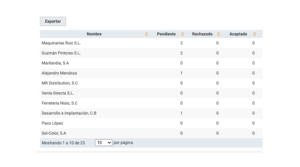
- Incident reports: Information on the clients with the most incidents or which employees have the most incident tickets assigned.
- Stock reports: Assessment of the products and services we offer and their evolution over time.
4. Effective visual examples of reporting
In addition to being organized by areas or management zones, reports can be classified by graphics and information display elements.
There are more than 200 visual elements that can be used for this type of report, although the most used are columns, bar charts, lines, tables, and pie charts.
5. How do I start creating reports for my company?
Each company will approach the data in different ways and will find different solutions for the same display situation.
You do not need to add expensive external tools to your business to get good business reports.
There are many tools on the Internet, but as we have mentioned before, nowadays, a good management software like STEL Order generates the necessary reports to incorporate business strategies based on the use of data (business intelligence) without having the information of your company distributed in several software.


